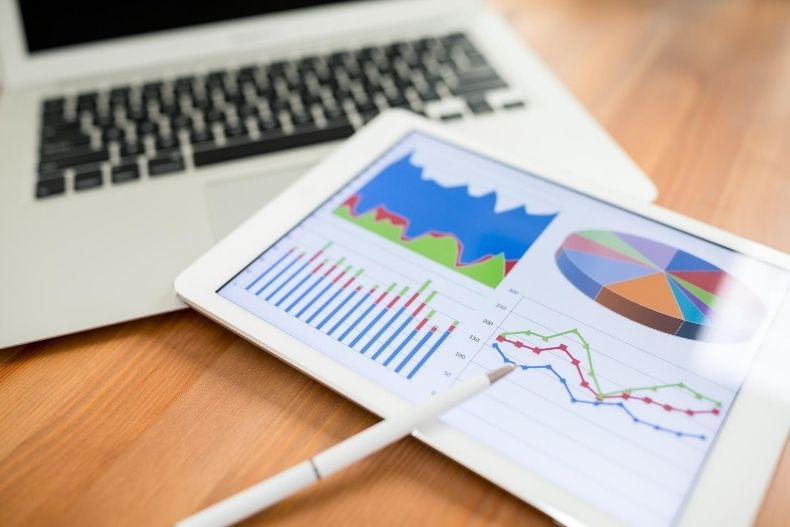
In a world that’s becoming increasingly digital, CFOs are noticing a rapid change in how their customers want to interact with the financial world. Digitization and the accessibility of programming classes have led to the creation of financial dashboards and other strategic inventions. For businesses to compete, they need to adopt dashboards to analyze data.

What is a Financial Dashboard?
A financial dashboard is a business intelligence tool that allows accounting and finance teams to track reports on key performance indicators (KPIs). Modern financial dashboards offer data visualization, reporting, and analytics that help teams improve profitability while reducing their overall costs. The best dashboards collaborate data from multiple sources.
Financial dashboards streamline financial reporting because it allows teams to better predict where their money will be spent. Budgeting becomes a breeze when you have real-time data right in front of you. Dashboards also remove busy work, like preparing spreadsheets.
Financial Dashboards: Analytics and Adaptability
In the past, CEOs and CFOs have relied primarily on intuition when creating a budget because it was difficult to collaborate data a business could use. Digitization has made it simple to view analytics and adapt quickly to consumer trends and economic changes out of their control.
Analytics
A business that offers a product or service to its consumers can’t afford to stay unconnected from its customers. Nowadays, customers are willing to provide their personal data if a company offers a better experience or a deal. Programmers will use cookies to sell more effectively, but without some way to group these analytics together, that information will be lost or unusable.
Customer intelligence will become a predictor of profitability and growth, and a financial dashboard can group data for businesses without the need for a programmer or CFO. However, if a CFO does use a dashboard, they can use their expertise to budget or sell more products.
Adaptability
Since other companies are using financial dashboards, CFOs should use them to stay competitive. A financial manager can tell a story using visuals and graphs to make data-based decisions with a dashboard. While that’s a quick way to make financial gains, a business can make more informed investments and help stakeholders weigh priorities in the long term.
Overall, a financial dashboard is an investment in both time and money, as it will lead to success, profitability, and efficiency. Dashboards can also improve the customer experience, automate repetitive administration tasks, and help companies stay ahead in uncertain times.
How to Use a Financial Dashboard
Businesses that are ready to start using a financial dashboard should use the following pointers.
- Create a Diverse Group That Identifies Key Metrics: Don’t just use your CFOs to develop metrics your company should follow. Ask your marketing, programming, and development team what functional areas need focus. If the organization unanimously agrees to a metric, that’s a good sign that these metrics will succeed.
- Pilot the Dashboard Then Adjust: It’s common for businesses to set their metrics and walk away from the program for a while, but you’ll miss out on feedback. Some metrics may not serve your business as well as you hoped, so you must watch for changes. If a metric isn’t creating a positive impact on your business, adjust accordingly.
- Performance vs. Target: When you first use dashboards, your targets will be measured based on the previous year’s marketing budget. Instinct will play a role initially, but you can stop relying on guessing as you use the dashboard. When displaying these metrics, present your targets beside actual performance to set better targets in the future.
- Maintain the Dashboard: Most dashboards are customizable to fit your needs, but sometimes too much functionality can bog down the process. Create a dashboard that’s easy for you and your team to maintain. You’re purchasing this software to simplify the process, so only prioritize tools that are painless to update monthly.
The benefits of data visualization don’t stop there. Through visualization, businesses can identify the correlation between separate data points and examine the market more effectively.